8 Shops. 40 Cells. No Room for Confusion.
How I led the design of a shop floor execution tool that replaced paper-based chaos across two industries, eight shops, and a global repair network — without losing technicians along the way.
My Role
- Experience Architect
Duration
- Multiple Years
Collaborators
- Product Managers
- Engineering Teams
- UX Designers
- Shop Floor Users
Skills Used
- Design Leadership
- Ethnographic Research
- Problem-Solving
- Whiteboarding
- Wireframing
- Prototyping
- Usability Studies
The Problem
A Global Repair Network Running on Paper and Prayer
Imagine you’re a highly skilled industrial technician. You’re responsible for repairing complex rotating components — parts that will eventually go back into jet engines, keeping aircraft in the air, or gas turbines keeping power grids running. Your shift starts, and the first thing you do is grab a paper packet.
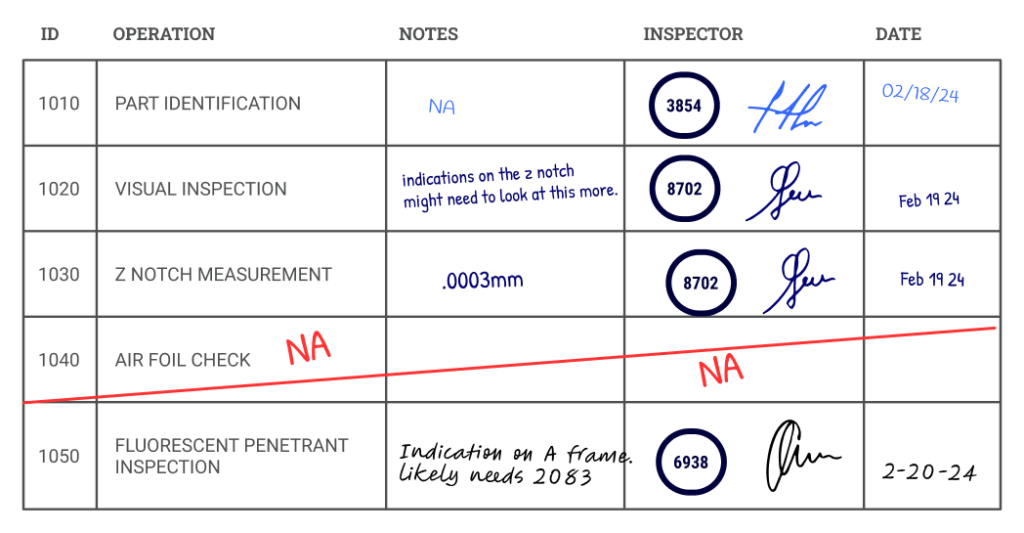
That packet is your entire source of truth. It tells you which parts to work on, which tasks you’ve completed, and what quality checks need to happen before a component moves to the next stage. It’s covered in stamps, handwritten notes, and ink from three different colored pens, because that’s how the system was designed… decades ago.
Before — The Paper Router
This wasn’t just an aviation problem. GE Aviation repairs the jet engine components that keep commercial aircraft flying. GE Power — now GE Vernova — repairs the gas turbine components that keep power plants running around the world. Both businesses operate high-stakes component repair shops. Both were running on paper. And because jet engine and gas turbine components share enough mechanical similarity, both businesses were eventually brought together under one software platform: SmartShop.
Across eight shops — four in Aviation, four in Power — each facility had been acquired over decades and left to run its own version of the paper process. Vocabulary was different. Roles were named differently. The sequence of operations varied shop to shop. There was no standard across the network and no visibility into what was happening on any floor at any given moment.
The core problem: Critical repair data was locked in paper packets — inaccessible to design engineers, invisible to customers, and vulnerable to damage or loss.
For Aviation, FAA compliance depended on documentation that could physically disappear. For Power, the same data was needed to keep turbines — and the grids they powered — running reliably.
For technicians, this was daily friction. For both businesses, it was a data black hole. For customers on both sides, complete darkness about where their parts actually were.
The Approach
Start on the Floor, Not in a Conference Room
The first thing we did was get on a plane. Before any wireframe was drawn, the team traveled to component repair facilities to watch technicians actually work. We stood back. We observed. We asked questions only after we understood what we were seeing.
This wasn’t a one-time visit. Over six years, we conducted ethnographic research at GE service shops around the world — contextual inquiry sessions, co-design workshops, and usability studies on the floor, in the environment where the software would actually be used.
The challenge that shaped everything: we weren’t designing for one shop, or even one industry. We were designing a single application that had to work for jet engine repair technicians at GE Aviation and gas turbine repair technicians at GE Power — two different businesses, two different regulatory environments, two different cultures, and eight shops that each operated differently. Some were large-scale industrial facilities. Others were smaller, more specialized cells. All of them were working with rotating equipment, heavy tooling, and zero tolerance for error.
Key research insight: Across every shop we visited, the same theme emerged. Technicians didn’t want software that tried to teach them their job. They wanted something that stayed out of their way. They were experts. The tool needed to act like one too.
To manage design consistency across four engineering teams and multiple shops simultaneously, I led a multidisciplinary UX team distributed across the US and Europe. We ran on a two-week sprint schedule, held regular design critiques against our core product principles, and maintained a shared SmartShop design system with a living style guide in Storybook. I also created an internal research series called ShopTalk, recorded presentations that brought user insights directly to engineering teams who couldn’t make the on-site trips.
The Key Decision
The Case Against Rebuilding Excel in a Browser
The most significant design battle of the project happened early, and it shaped the entire product. When discussions turned to how technicians would interact with job data on screen, GE Aviation’s more traditional stakeholders had a clear vision: a large data grid. Essentially, a spreadsheet. Every part on a job, every task, every field — all in one big table to navigate and fill out.
The logic wasn’t unreasonable. The stakeholders pushing for it knew data grids. They were familiar. They’d been used internally for years. For people who spent their days in spreadsheets, it was an intuitive mental model.
But we’d been on the floor. We knew what that would actually mean for a technician.
GE Power’s leadership was already leaning toward something more innovative. Less anchored to legacy tools, they were open to rethinking the interaction model entirely — which gave us the room to prototype an alternative. The idea that became the bingo board came directly out of that collaboration: a visual part-status board that let technicians see, at a glance, which parts were done, in progress, or flagged — without reading a single row of data.
“A man just wants to push a button.”
— Shop floor technician, during early discovery research
That quote became something of a north star for the team. It wasn’t anti-complexity — these technicians understood complex machines better than most engineers. But when it came to their software, they wanted clarity and speed, not cognitive load.
User testing validated the approach decisively. When technicians sat down with the prototype, the task-first layout was faster, less error-prone, and significantly less stressful in a noisy, high-stakes environment. The stakeholders pushing for the grid didn’t immediately capitulate — there was still skepticism, and frankly, some politics to navigate. But through a combination of user testing evidence and sustained relationship work with key decision-makers, we got there. The data grid never shipped.
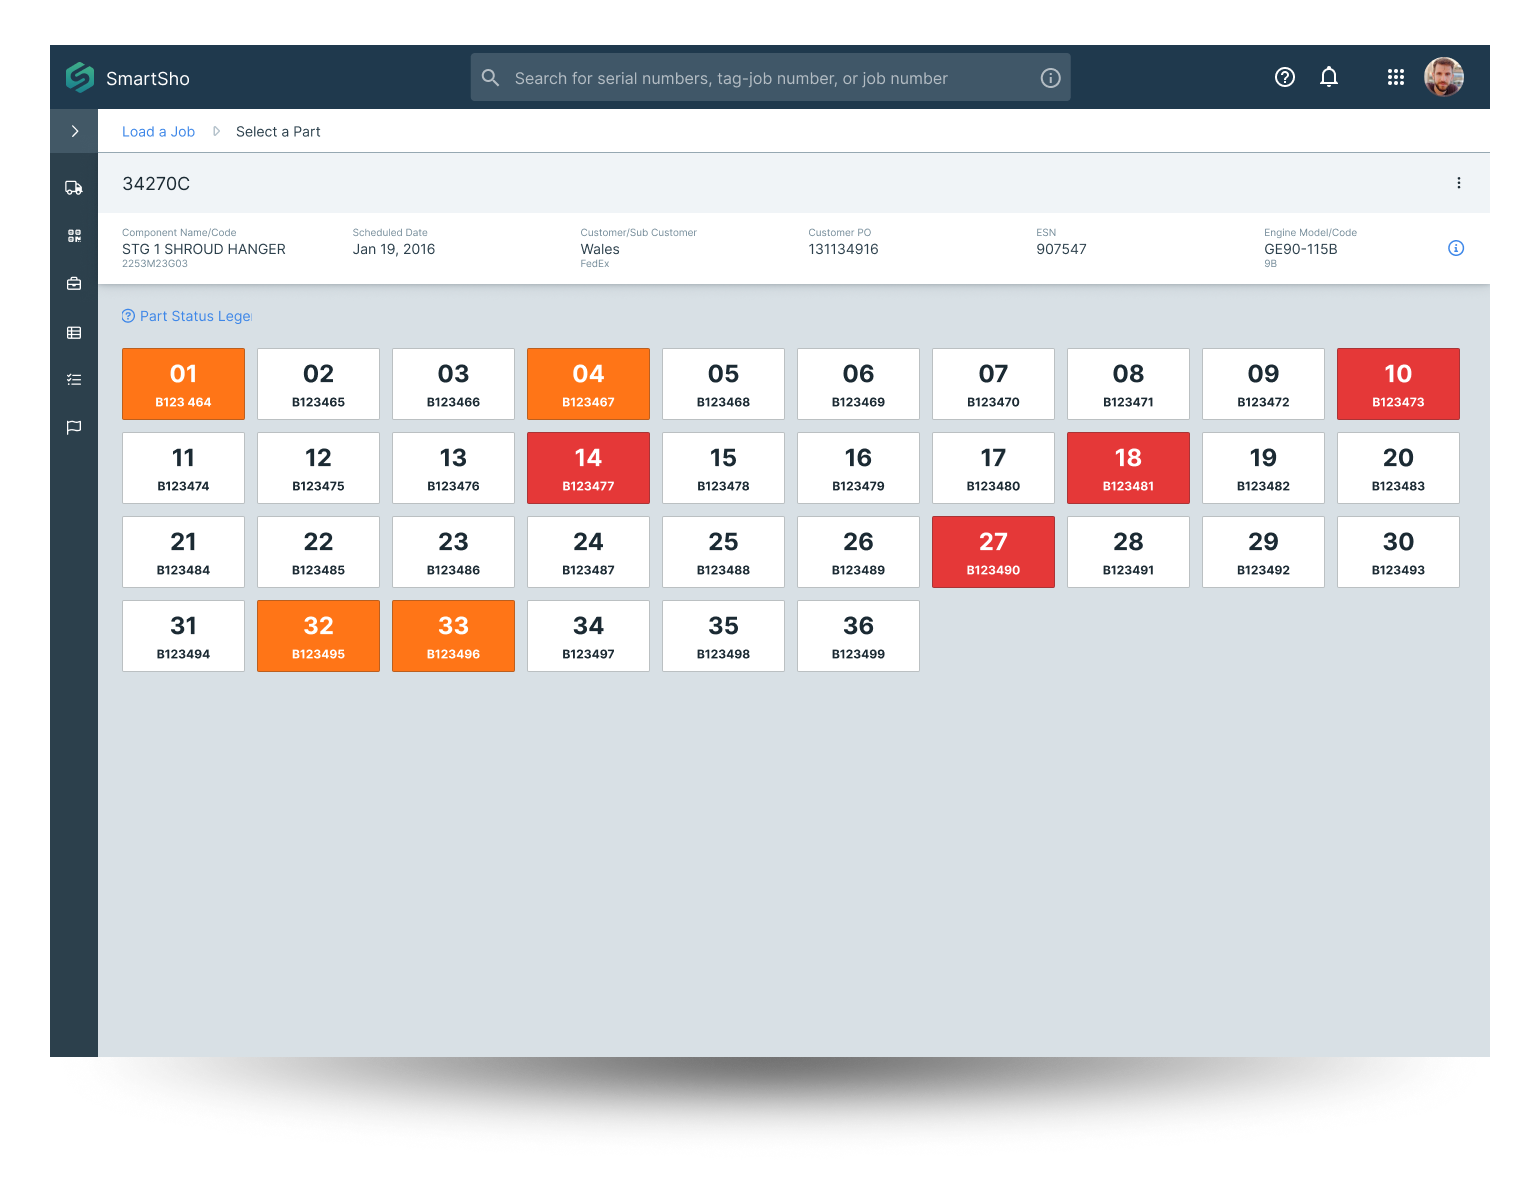
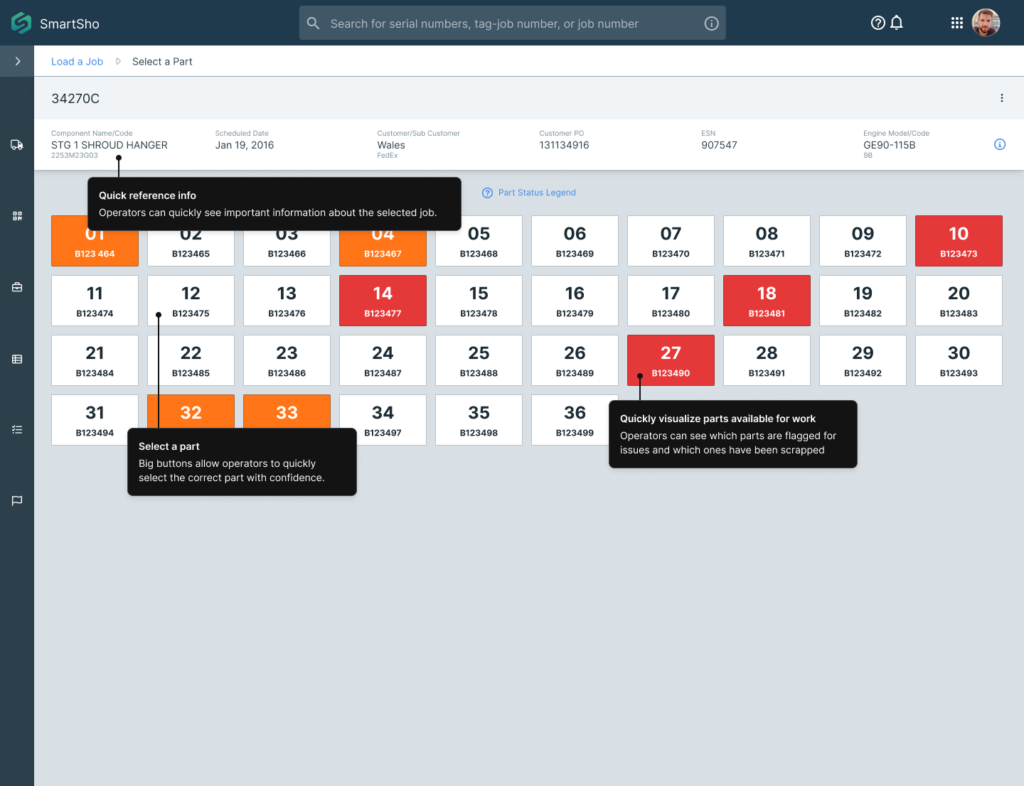
After — The Bingo Board
The Solution
Big Buttons. Clear Status. No Paper.
SmartShop replaced the paper packet with a digital execution flow designed around how technicians actually work. Built for tablets on the shop floor, operable with gloves, readable at a glance, and fast enough that it never interrupted the work itself.
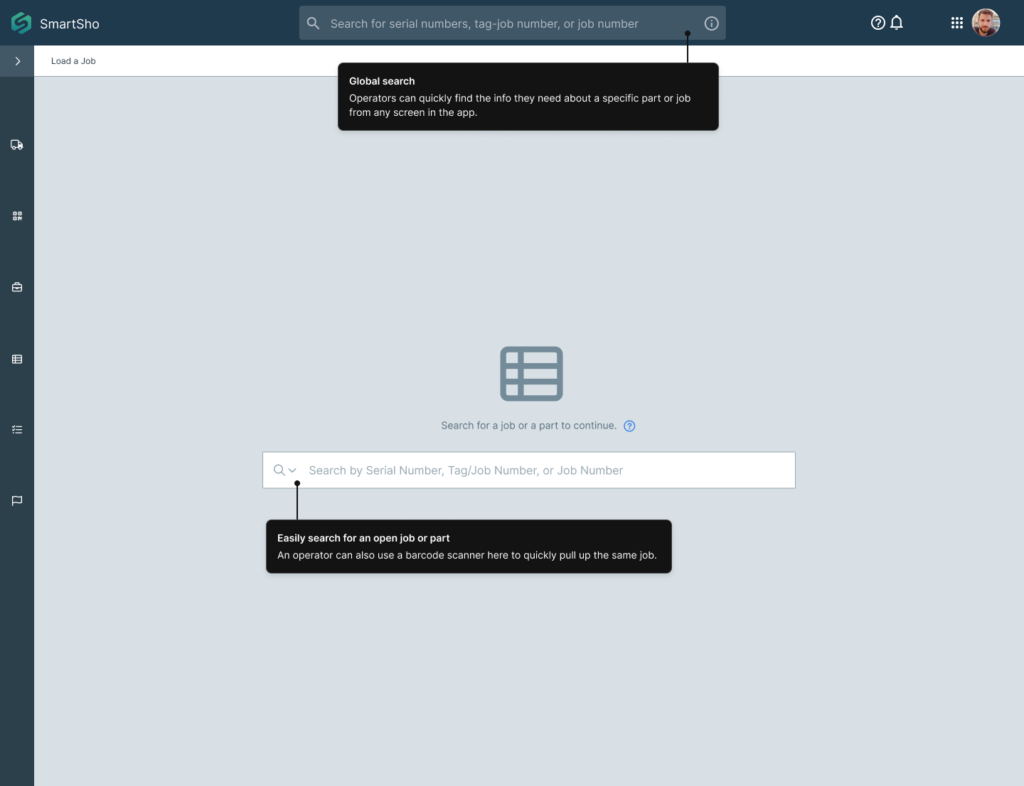
The flow starts simple: search for a job or scan a barcode to load it.
Entry Point — Load a Job
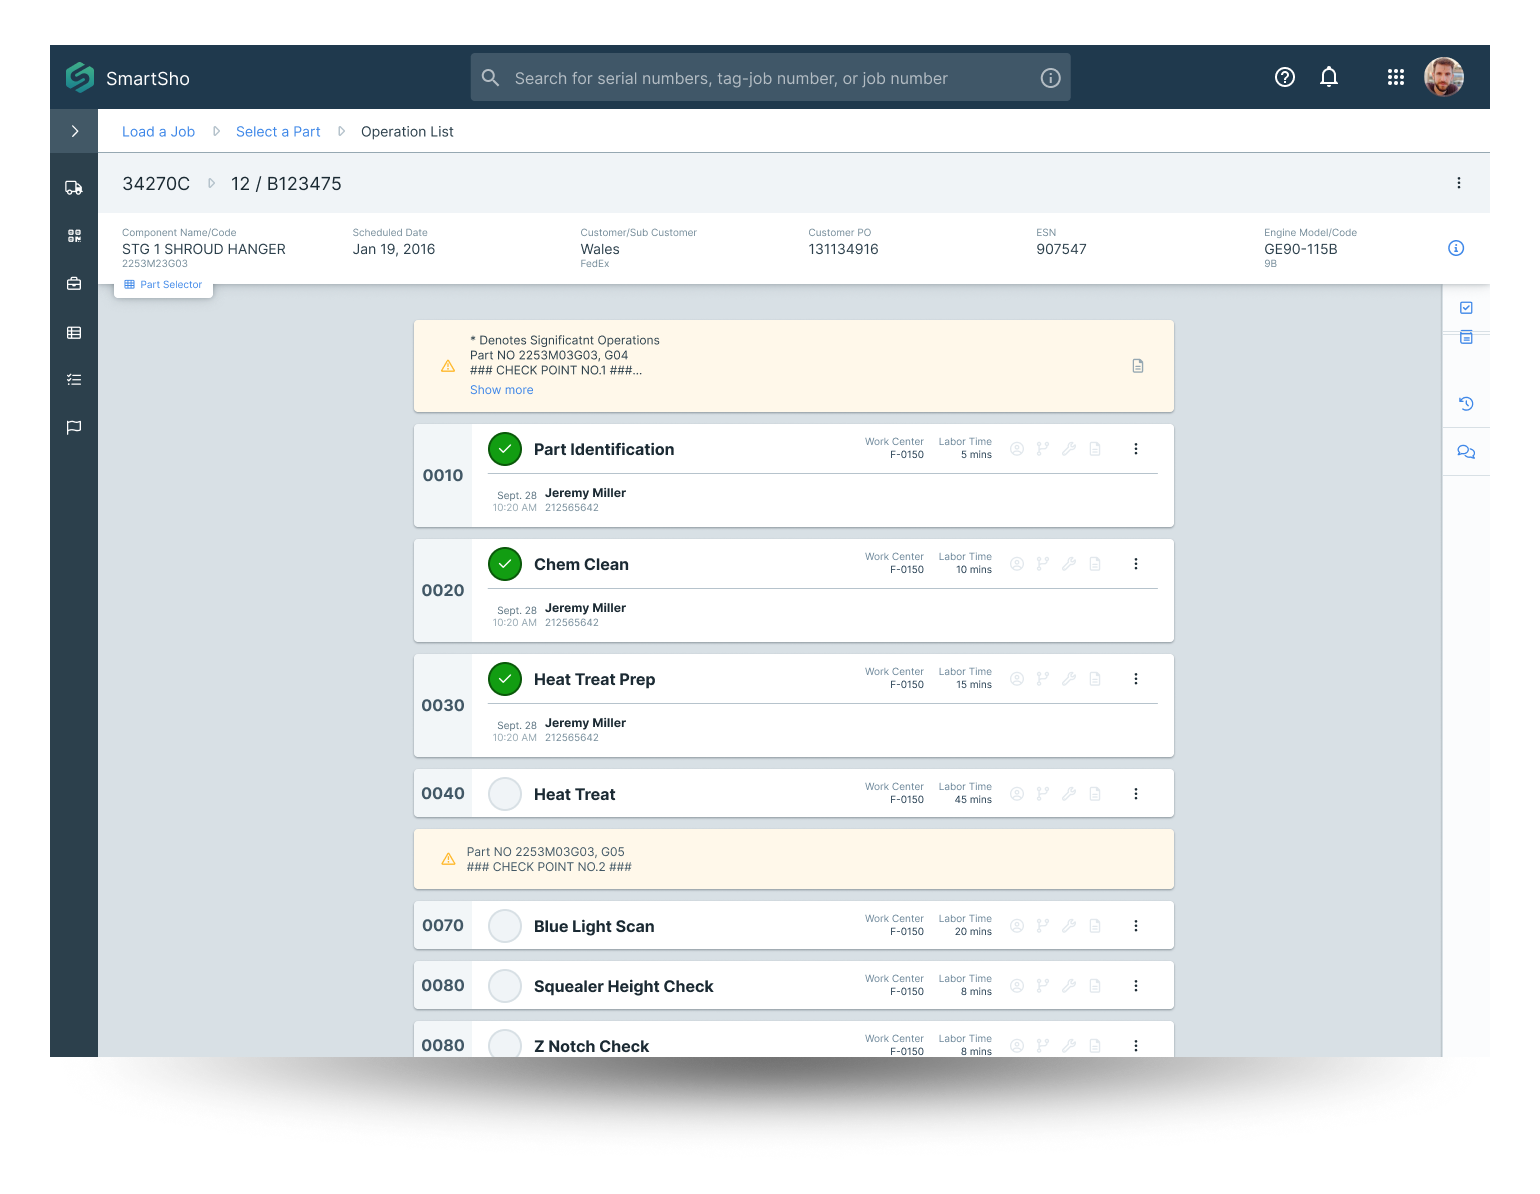
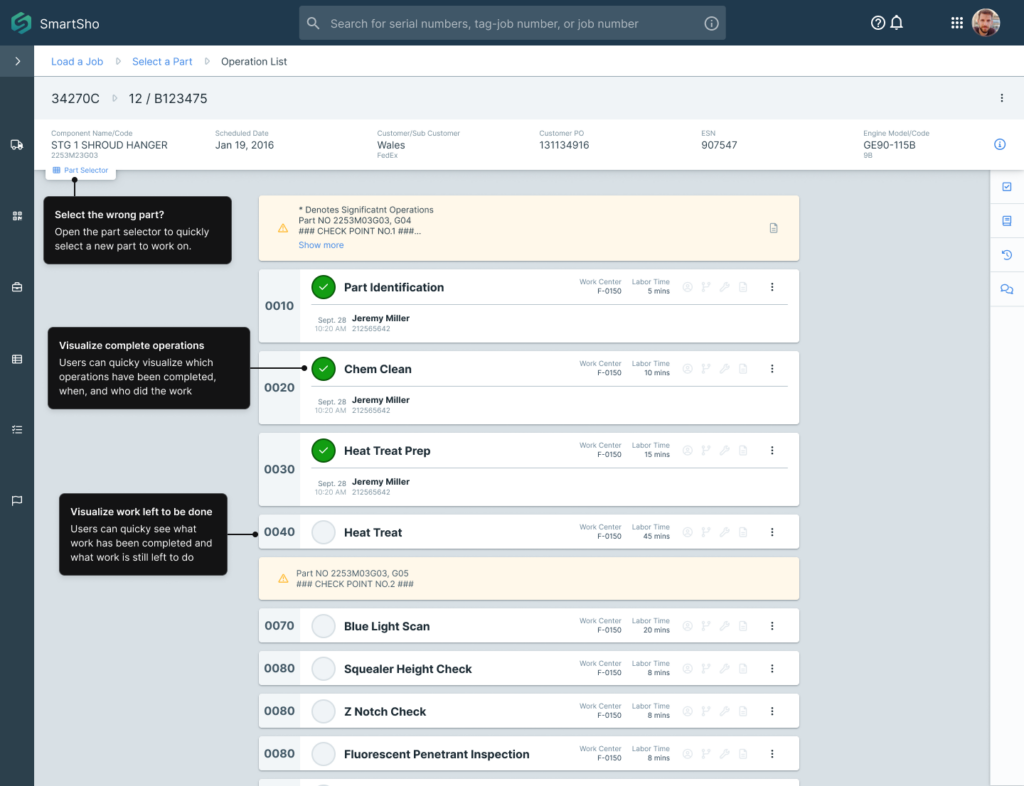
From there, they land on the bingo board — already shown above. Selecting a part brings up the operation list: a digital task list showing exactly what needs to happen, what’s already done, who did it, and when. The paper equivalent was a page of handwritten stamps. Here it’s a clean, scannable list with built-in accountability.
Operation List
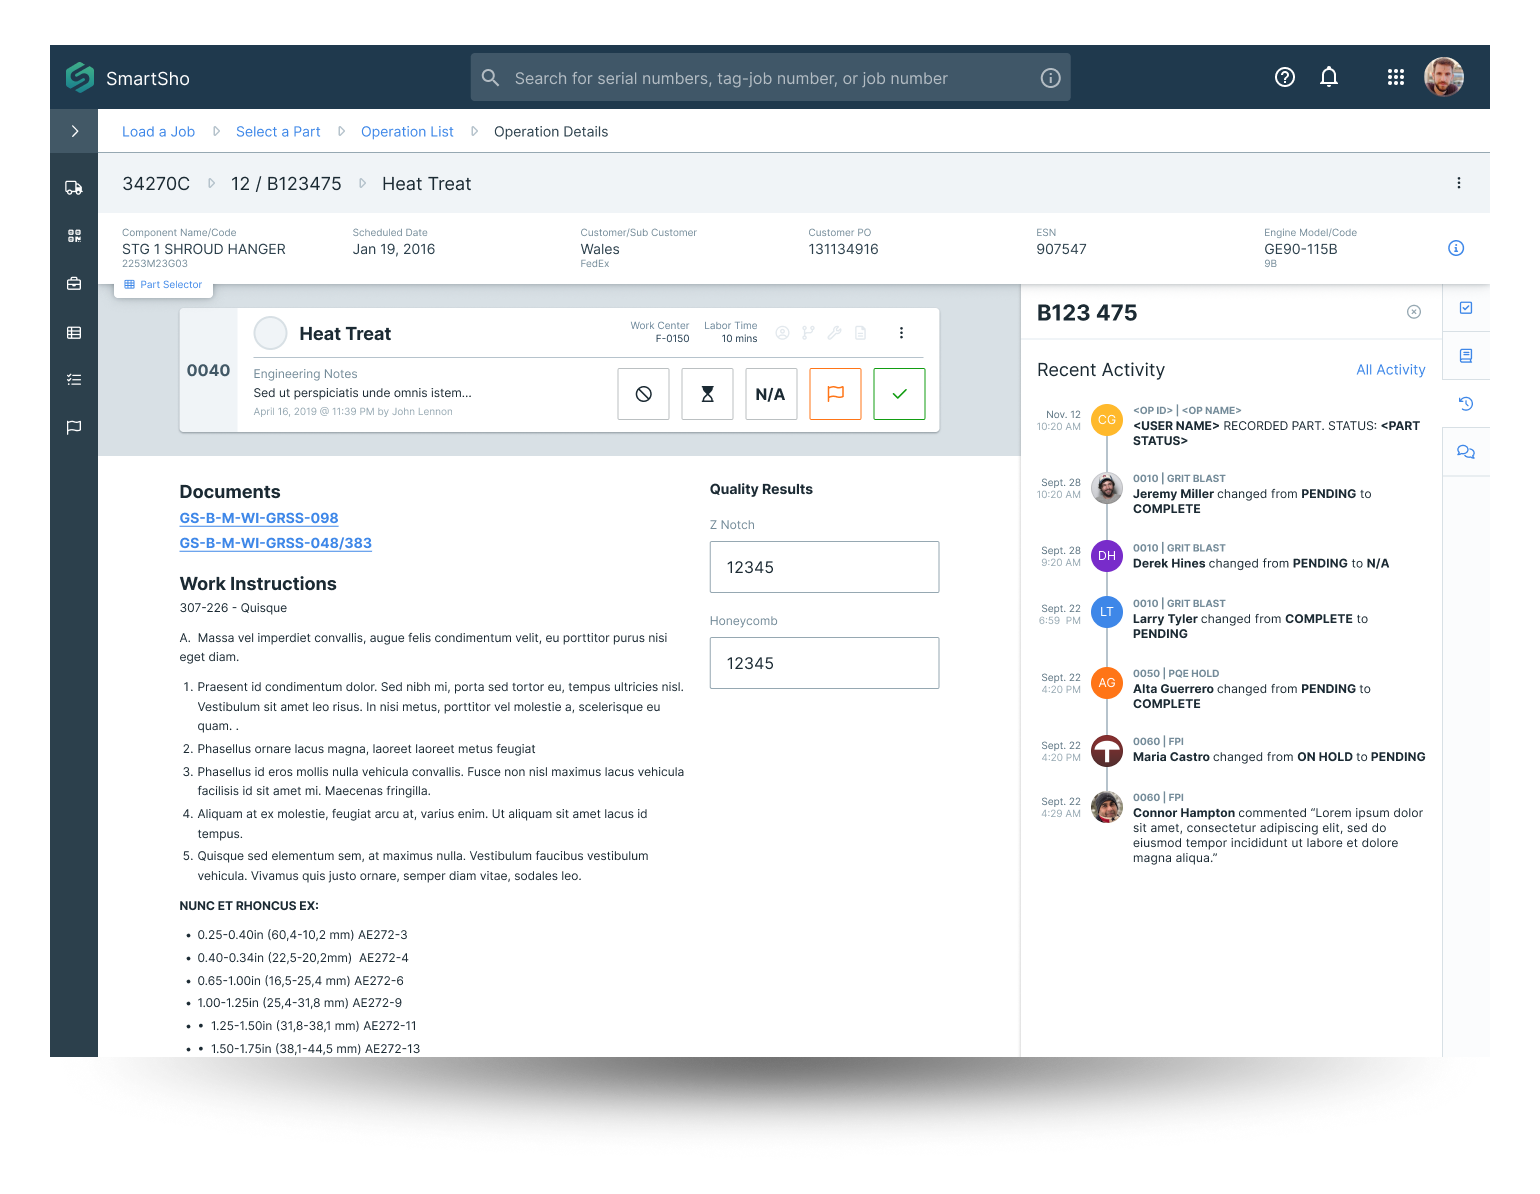
Tapping an operation opens the detail view — where the actual work gets recorded. Large touch targets, designed to be actionable with gloves on, in poor lighting, next to a piece of industrial equipment. Work instructions live right on screen, so there’s no paper manual to track down.
Operation Details
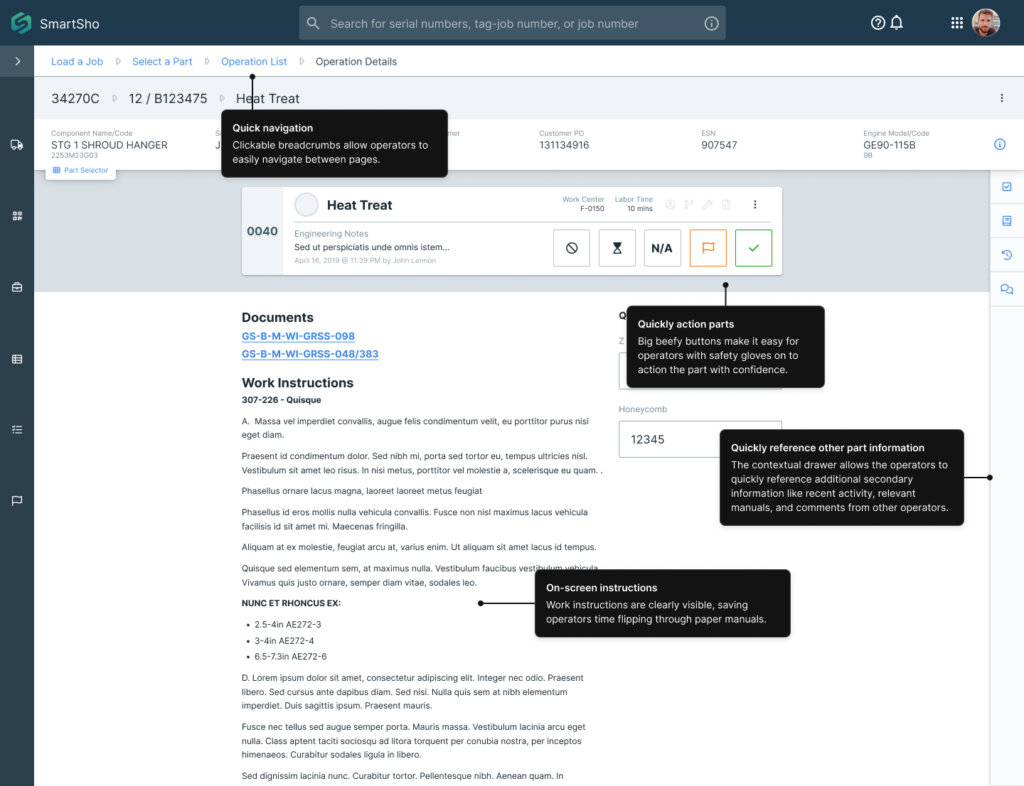
When a technician is ready to move on, a part switcher in the header lets them jump directly to a new part without navigating back to the board — useful when working through a job sequentially and you don’t want anything breaking your rhythm.
SmartShop replaced the paper packet with a digital execution flow designed around how technicians actually work. Built for tablets on the shop floor, operable with gloves, readable at a glance, and fast enough that it never interrupted the work itself.
The Impact
What Actually Changed on the Floor
Results were measured across two facilities on opposite sides of the industry divide — GE Aviation’s McAllen Component Repair Facility in Texas, repairing jet engine components, and GE Power’s GEMTEC facility in Saudi Arabia, repairing gas turbine components for power plants across the region.
−2.5 hrs
Work scoping: from 3 hours to 30 minutes per job
At McAllen, this single improvement saved 54,402 labor hours annually. Work scope splits were eliminated entirely, saving an additional 10,617 hours per year.
11k hrs
Final inspection time reclaimed annually
Paper-based final reviews were replaced with instant digital sign-off. What once required physical document assembly and manual review was resolved in seconds.
67%
Reduction in daily WIP tracking time
Shop leaders could now see exactly where every part was in the repair flow without walking the floor. At McAllen, 5,200 hours saved per year across 10 cells.
53%
Faster lead times at GEMTEC Saudi Arabia
Lead times in the P50 cell dropped by 33 days. Labor hours decreased by 10 per job. Customer reporting went from 2 to 6 reports per week — a 300% increase in transparency.
$1.6M
Reduction in work-in-progress capital
With real-time visibility into part status, GEMTEC cut WIP inventory by 50% — $1.6 million in capital that was previously tied up waiting for paper processes to catch up to reality.
80k+
Total labor hours saved annually — per shop
Across a global network of component repair facilities, this improvement compounded with every new shop that came online.